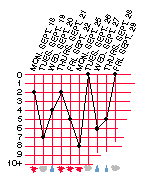
 Turn your absences into a learning experience with a chart:
- Using one sheet of paper per month, draw a grid where vertical lines represent school days for that month and 11 horizontal lines represent number of students absent, with 0 on top and 10+ on the bottom. If you have room on a wall, attach an entire year in one long horizontal chart.
- Each morning, pick one student to draw a dot at the intersection of the day and number of students absent. Connect the dots to create a line chart.
- Add daily variables if you like with a vertical row of symbols under the 10+ line. These could be stickers or symbols the students draw in daily such as a sun, raindrop, snowflake, holiday smiley face, etc. (get students involved in thinking of outside factors that affect attendance). Then:
- Periodically, for a special project, students can tally up averages, comparing attendance on rainy days vs. sunny, pleasant temperatures vs. extremes, Wednesdays vs. days before or after holidays, to get a sense of how “everything is connected.” Building lots of variables into your chart means more options for projects.